There are several different ways to add dashboard panels to your selected dashboard. The following subsections will highlight some common methods of how to add a dashboard panel.
View Dashboard Page
To add a new dashboard panel, you will first need to be on the selected View Dashboard page. For more information on how access this page, please see the View Dashboard and Dashboard Panels page.
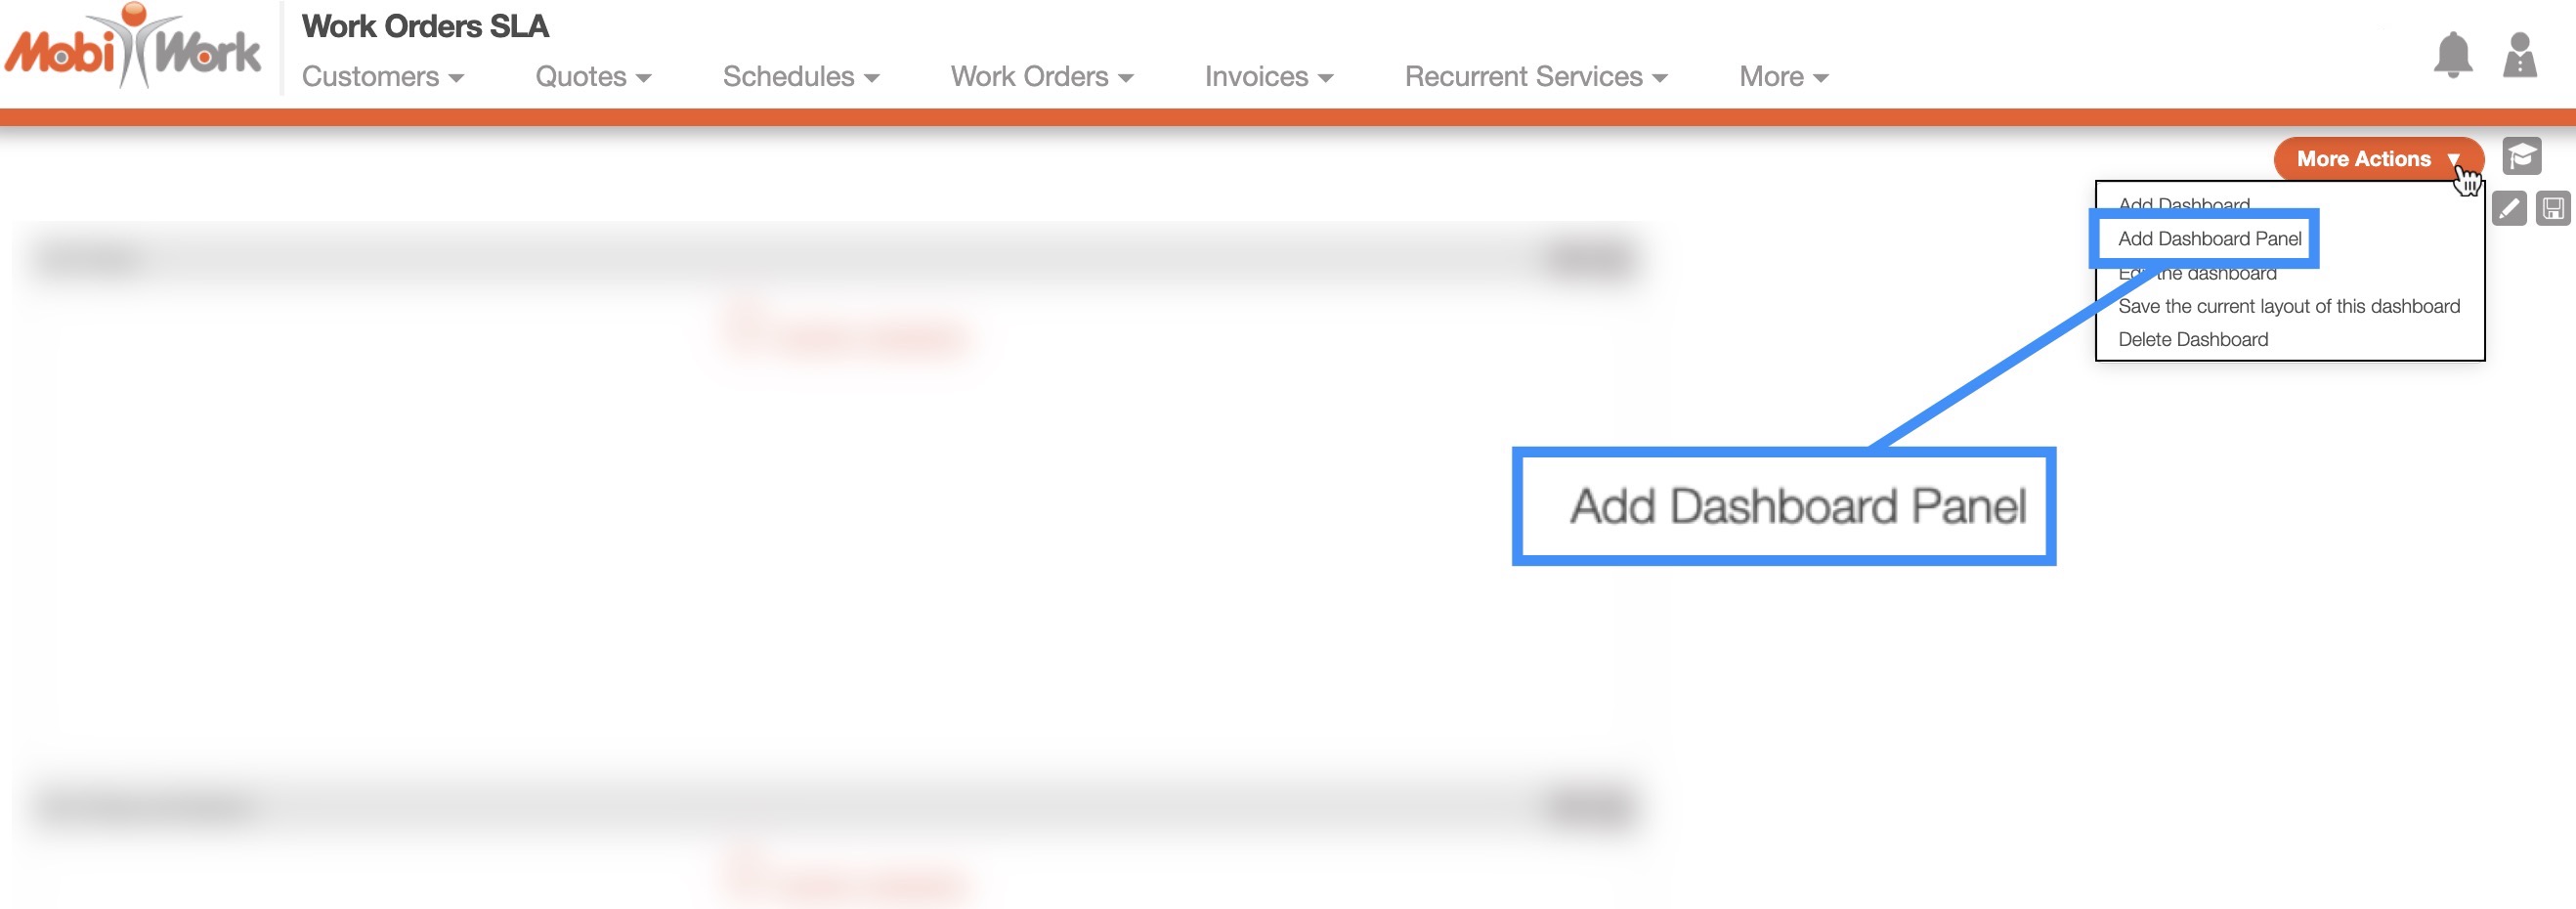
Once you are on the View Dashboard page, click on the More Actions button and select the "Add Dashboard Panel" option from the drop-down:
View Dashboard Panels Page
Another way to add a new dashboard panel is from the View Dashboard Panels page of the selected dashboard. For more information on how access this page, please see the View Dashboard and Dashboard Panels page.
Once you are on the View Dashboard page, there are two different ways to add a new dashboard panel:
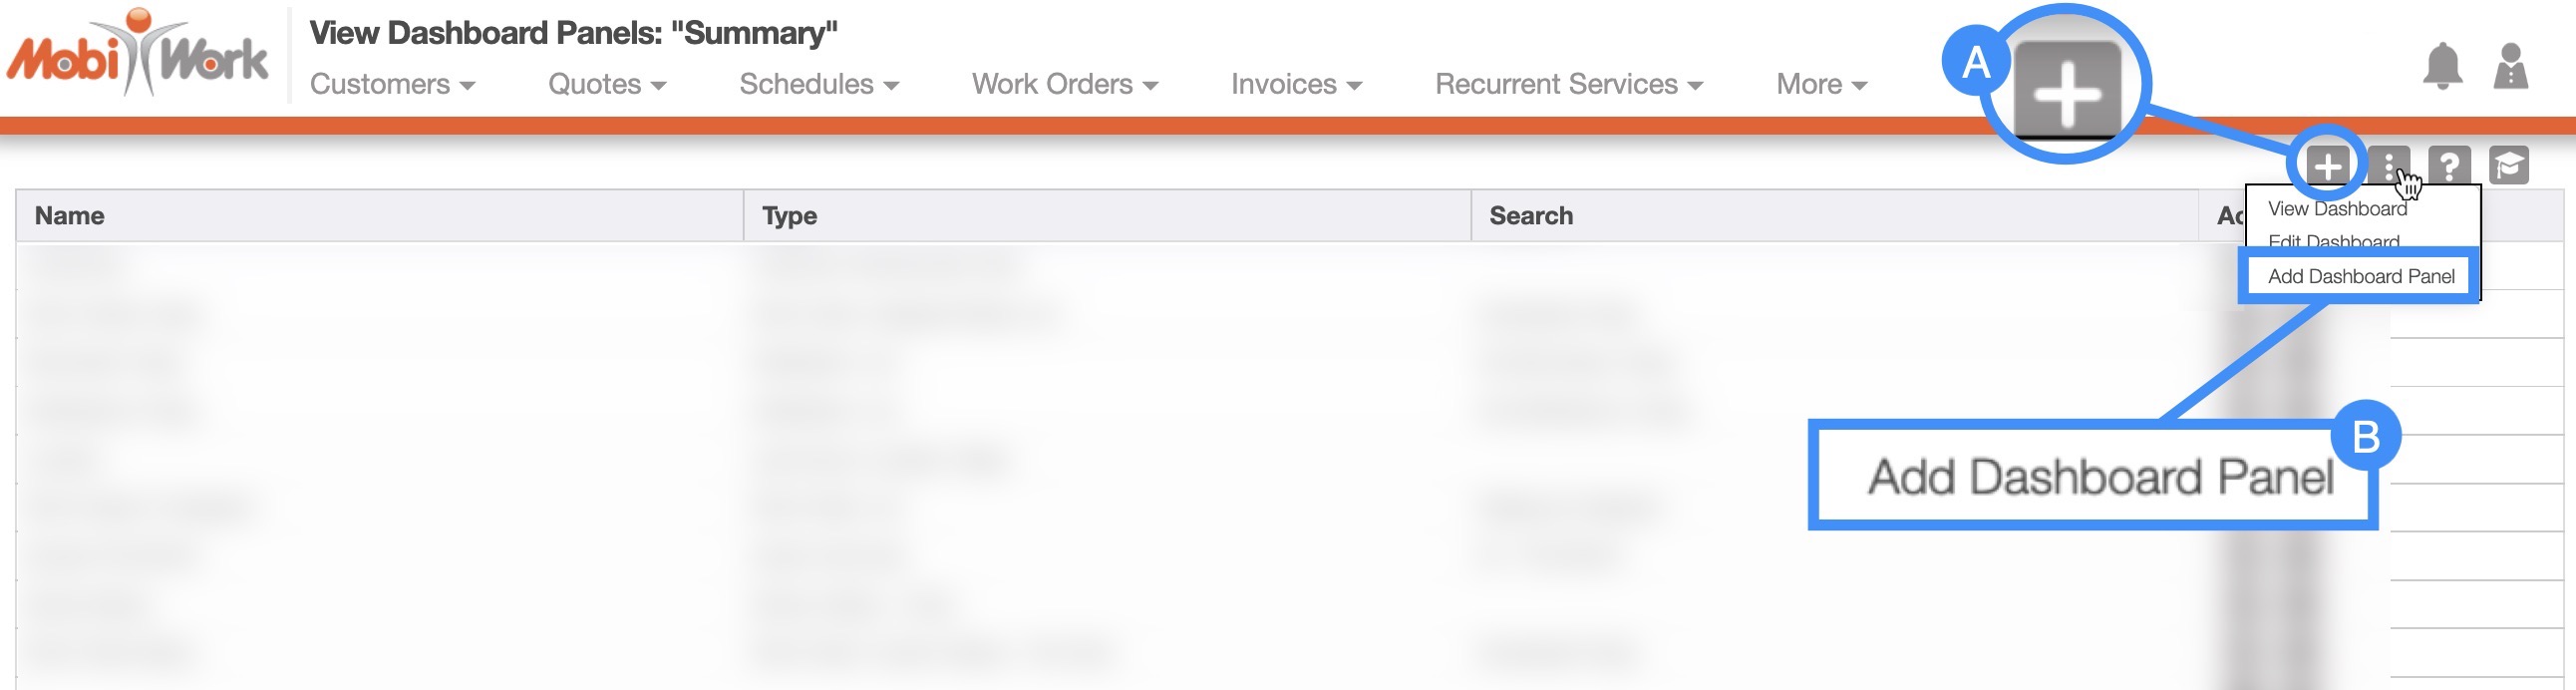
Click the Plus Sign option
Click on the Individual Actions button and from the drop-down select the "Add Dashboard Panel" option
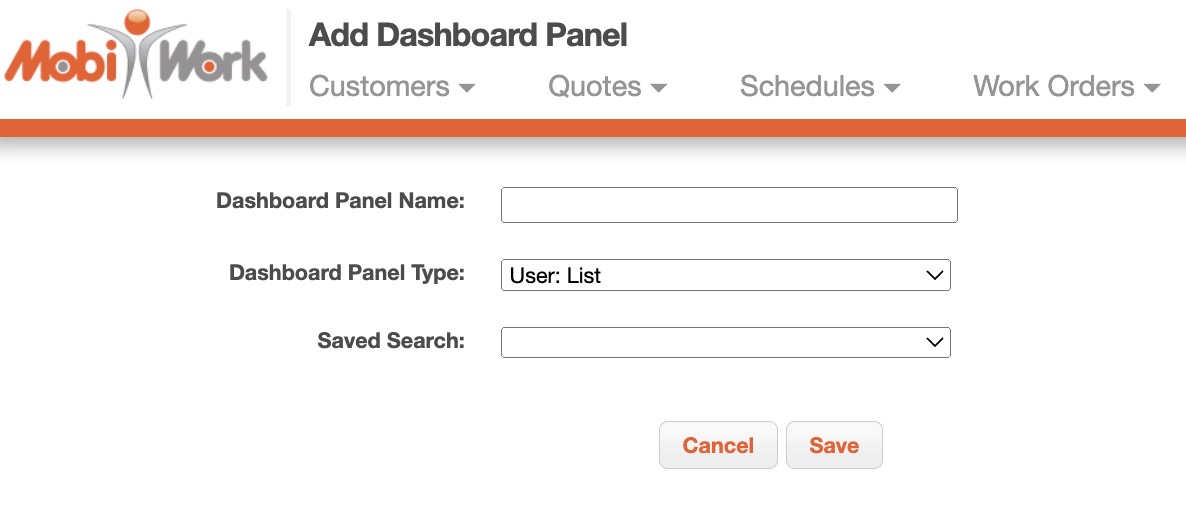
Regardless of the method you choose, you will be able to access the Add Dashboard Panel page. On this page you will be able to input the panel’s name, which MobiWork feature the panel draws its data from, and the type of data that will be displayed in the panel.
Once you are satisfied with the information provided, you can click the Save button to confirm the addition of the new panel. You should repeat this process until you are satisfied with the panels that appear in the dashboard:
Note: You can have multiple panels of the same type but with different data displayed. For example, you can have multiple Work Order List panel types, where one panel shows closed work orders, and another panel depicts open work orders. This ability to display multiple panels of the same type but with different data, will allow you to see a snapshot of everything going on in one screen.
The definitions for the panel types and the saved searches found on this page can be located below:
| Name: | Description: |
|---|---|
| "Dashboard Panel Name" | is the name of the dashboard panel. |
| "Dashboard Panel Type" | is the dashboard panel type. |
| "User: List" | displays the users who are using your MobiWork account. |
| "User Training: Chart" | is the user training that is up to date and overdue in a pie chart. |
| "User Training: List" | is the user training that is up to date and overdue in list format. |
| "User: Maintenance Status by Service Type" | is the user: maintenance status by service type in bar chart format. |
| "Last Known Location: Maps" | displays the last known location on a map by user, date, and time. |
| "Last Known Location: Inside Status - Chart" | displays the number of users inside a point of interest. |
| "Last Known Location: Device Status - Chart" | is the active, recent (within the last 90 minutes), active (between 90 minutes and 1 day), and no recent communication (over 1 day) in a pie chart. |
| "Last Known Location: Absence Time - Chart" | displays the last time users communicated with MobiWork. |
| "Last Known Location: Inside Status group by Supervisor - Chart" | displays the number of users inside a point of interest grouped by the supervisor of the users. |
| "Work Order: Status - Bar Chart" | displays the work orders closed vs not closed in a bar chart. |
| "Work Order: Custom Status - Pie Chart" | displays the custom statuses of work orders in a pie chart. |
| "Work Order: List" | displays the work orders in list format. |
| "Work Order: Monthly Numbers - Bar Chart" | displays the monthly work orders added, scheduled, and closed in a bar chart format. |
| "Work Order: Assigned Status List" | displays work orders by customer, custom status, assigned to, and assigned date. |
| "Customer: Status - Pie Chart" | displays customers by status in a pie chart. |
| "Customer: Monthly Growth - Bar Chart" | displays the number of monthly new customers. |
| "Customer: List" | displays the list of customers. |
| "Device: Status - Chart" | displays user devices by status (active, recent communication, active, and no recent communication) in a pie chart. |
| "Device: List" | displays a list of devices that use the MobiWork app. |
| "Sales Order: List" | displays a list of sales orders. |
| "Sales Order: Summary" | displays sales orders by number of sales orders and items sold, total sales amount, cost, profit, and margin. |
| "Sales Order: Map" | displays sales orders by location on a map. |
| "Sales Order: Hourly Count" | displays the hourly sales orders and aggregate sales orders. |
| "Sales Order: Daily Count" | displays the daily sales orders and aggregate sales orders. |
| "Sales Order: Monthly Count" | displays the monthly sales orders and aggregate sales orders. |
| "Sales Order: Yearly Count" | displays the yearly sales orders in bar chart format. |
| "Sales Order: Hourly Amount" | displays the hourly amount of sales orders in a bar chart. |
| "Sales Order: Daily Amount" | displays the daily amount of sales orders in a bar chart. |
| "Sales Order: Monthly Amount" | displays the monthly amount of sales orders in a bar chart. |
| "Sales Order: Yearly Amount" | displays the yearly amount of sales orders in a bar chart. |
| "Sales Order: Summary List" | displays sales order by client name, number of sales orders, number of items sold, total sales amount, and cost. |
| "Sales Order: Summary Chart" | displays sales order by number of sales orders, number of items sold, and total sales amount in a bar chart format. |
| "Asset: List" | displays a list of assets. |
| "Asset: Status" | displays the statuses of assets in pie chart format. |
| "Asset: Maintenance Status" | displays the maintenance statuses of assets in pie chart format. |
| "Asset: Maintenance Status by Service Type" | displays service type by overdue, upcoming, and up to date. |
| "Asset: List (Name Only)" | displays a list of assets by name only. |
| "Prospect: List" | displays a list of prospects. |
| "Alarm List" | displays a list of alarms. |
| "Message List" | displays a list of messages. |
| "Reminder List" | displays a list of reminders. |
| "Time Tracking Single User View" | displays time tracking information of a single user. Time tracking can be added from this dashboard panel. Note: Saved search should return records for one user. |
| "Payment Summary - User" | allows you to show payment collection based on each user. |
| "Project: Crew Work Order Custom Status" | displays the project crew work order custom status by project and crew. |
| "Project: Crew Work Order Action Item Status" | displays the status of each of the action items for the work orders created by the project work order action. |
| "Planogram Audit list" | displays a list of planogram audits. |
| "Planogram Audit Compliance" | displays compliant and non-compliant planograms in a pie chart format. |
| "Support Ticket List" | displays a list of support tickets by name, status, and clients. |
| "Notification: List" | displays a list of notifications. |
| "Invoice List" | displays a list of invoices including their total and balance. |
| "Task List" | displays a list of tasks including their status. |
| "Saved Search" | displays the list of saved searches already created for that entity. The dashboard will show the results from the selected saved search. |