The "Dashboards" tab will display your MobiWork dashboard information; from this page you can navigate to other tabs to view additional account settings:
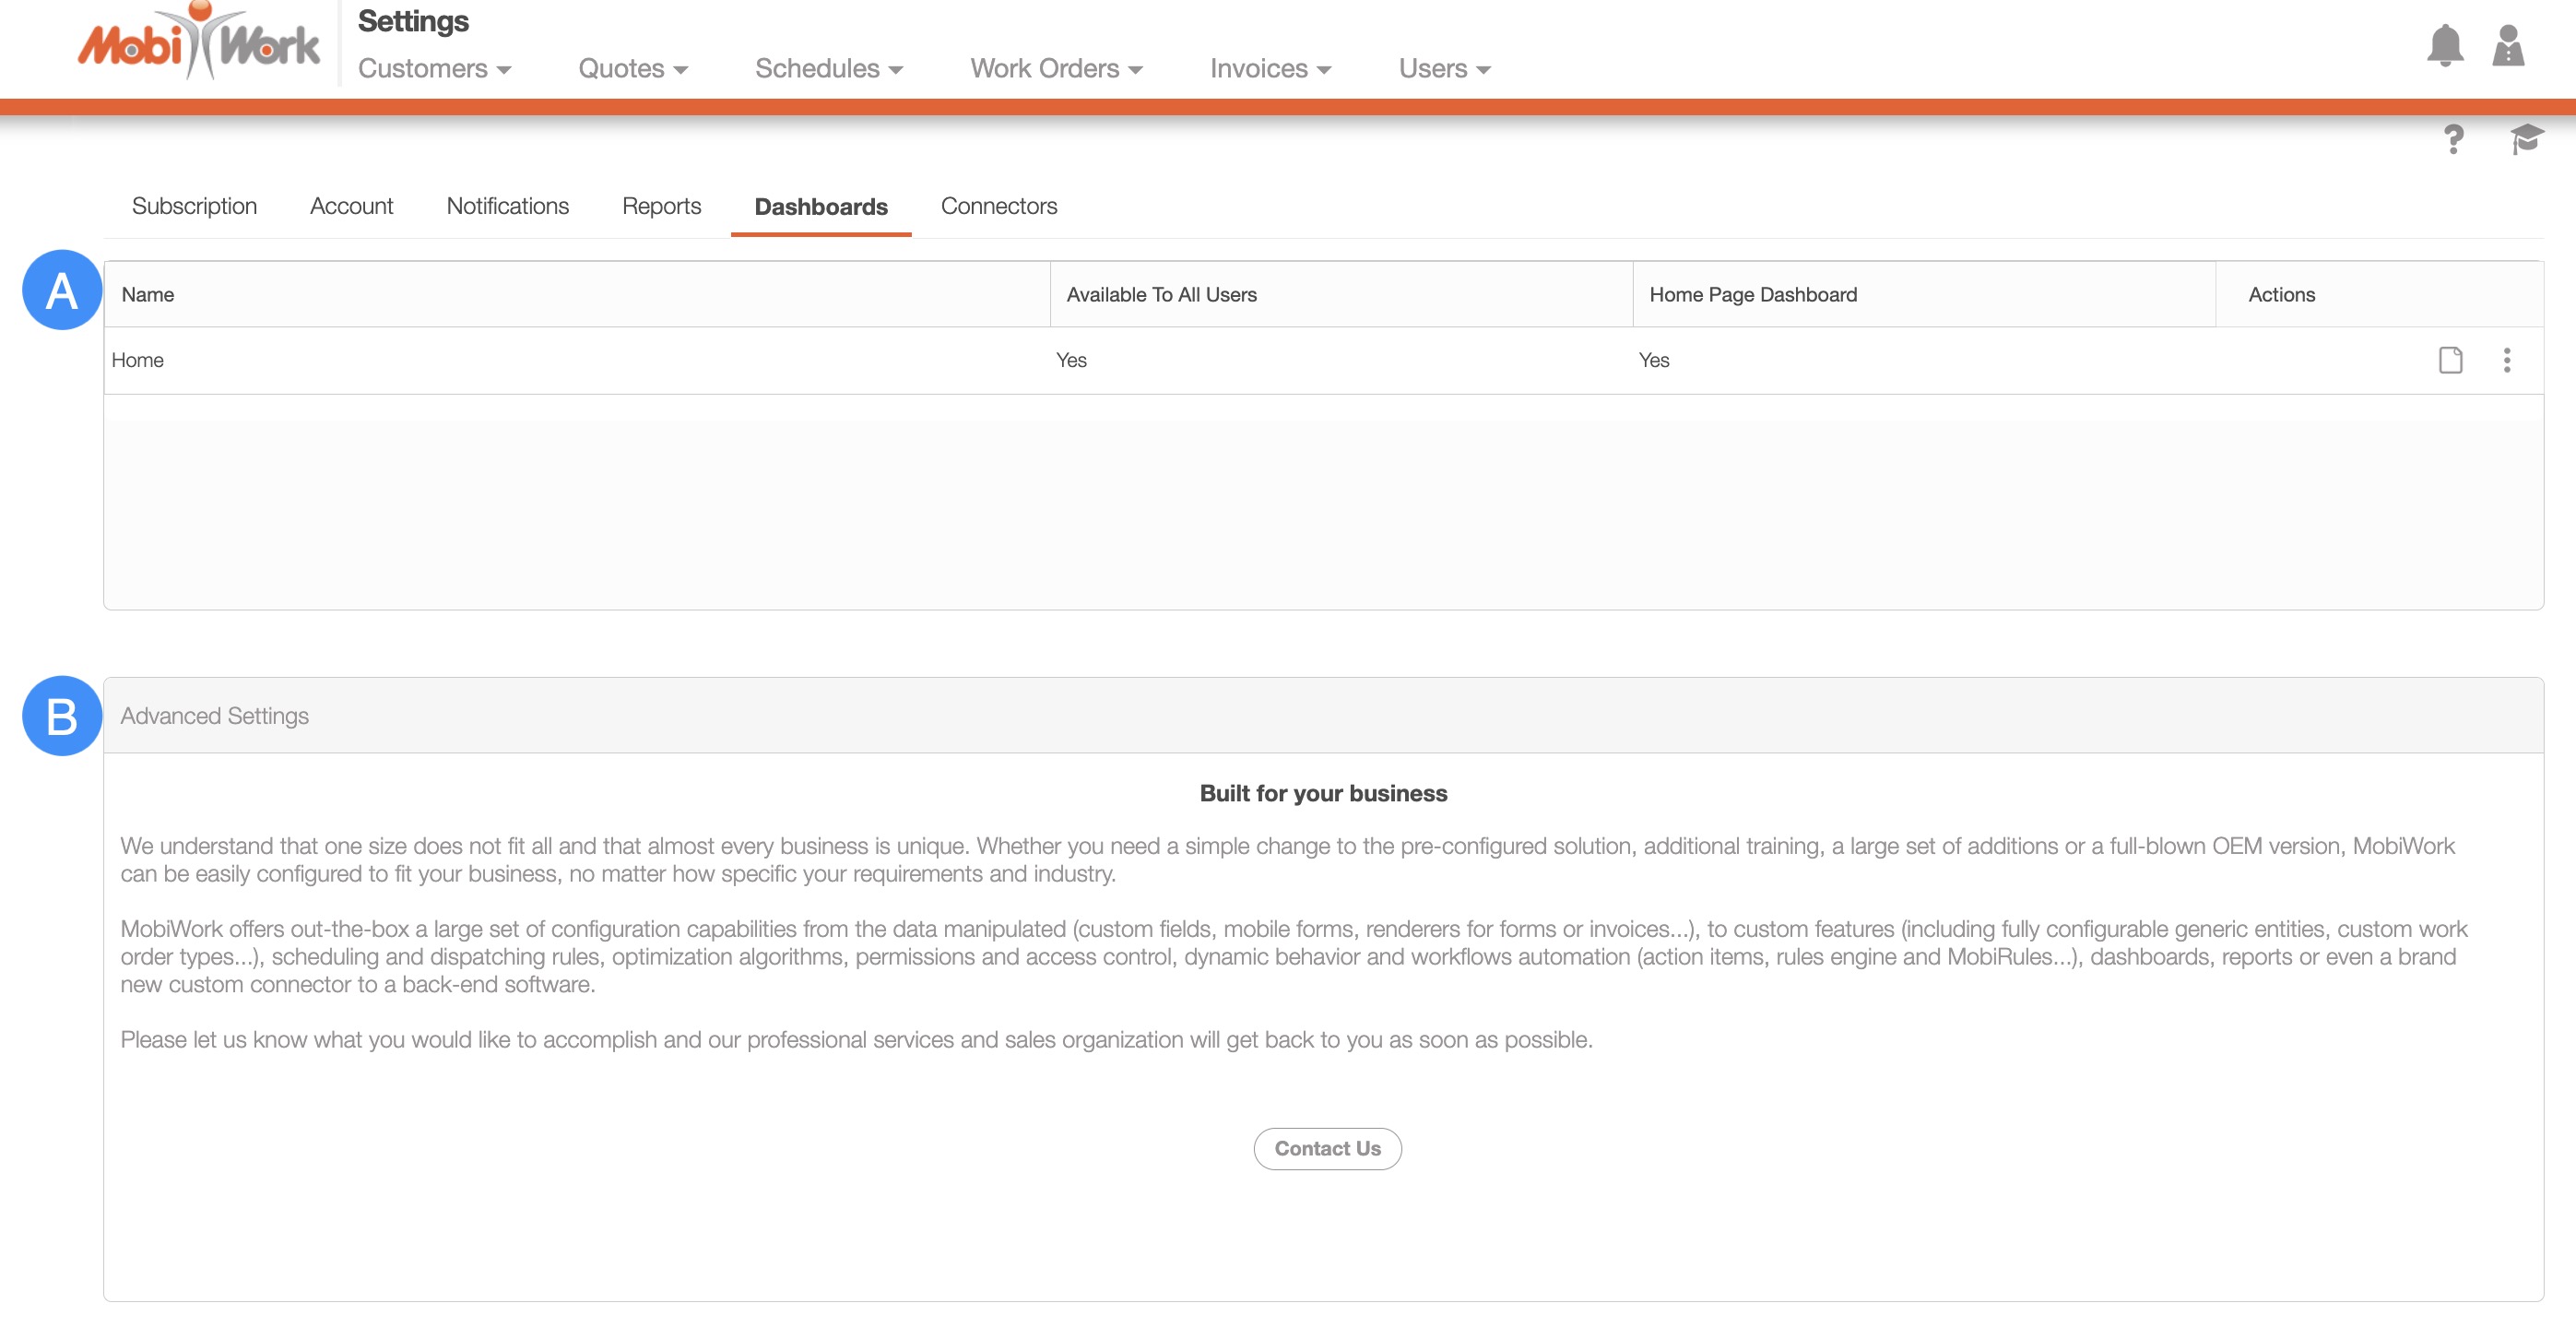
Some features (e.g., Advanced Settings, Global Actions, etc.) can be found in all the Tabs. Below is a list of the main features that are located on the "Dashboards" tab page:
The "Dashboard" column will display all the dashboards that are saved in your MobiWork account. Please note that in a starter account, you will have access to one dashboard which you can edit to display the desired information:
The following subsections will illustrate how to edit your MobiWork dashboard.
Dashboard
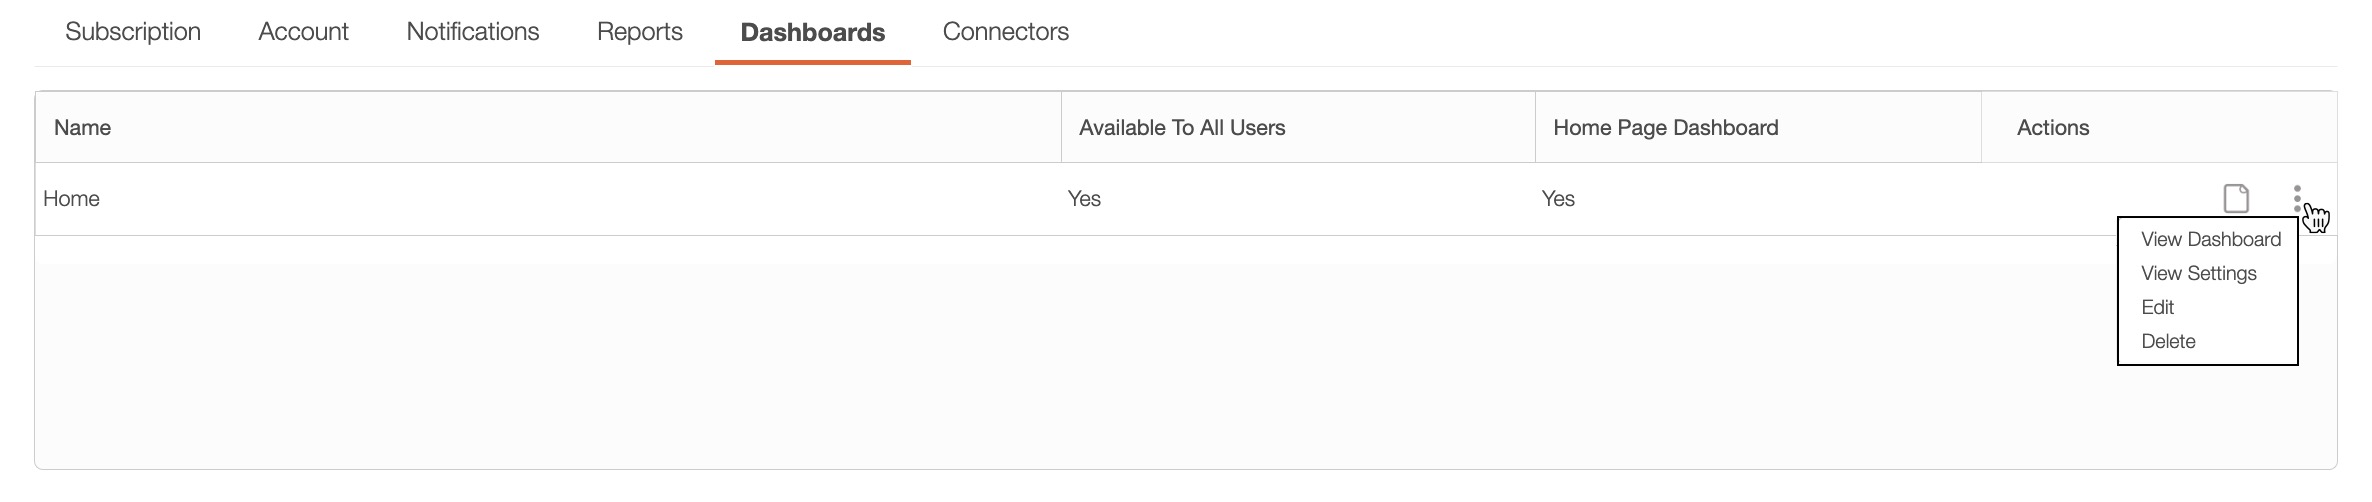
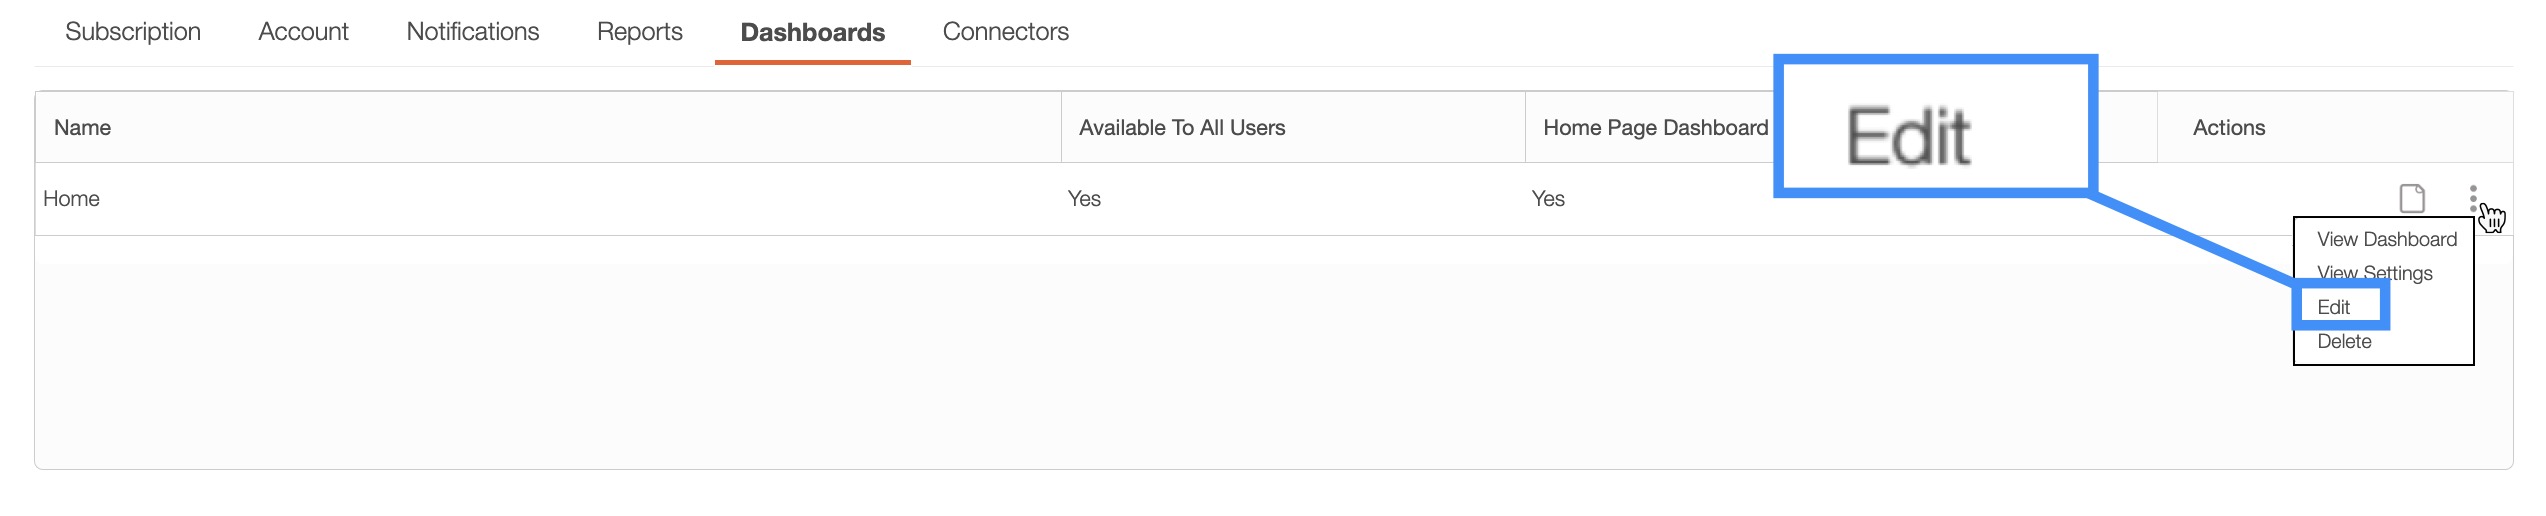
To edit the dashboard, select the "Edit" option from the Individual Actions button. You will then be redirected to the Edit Dashboard page:
On this page you will be able to update the name of the panel, the interval rate of when the data is refreshed, and who has access to the dashboard (i.e., as a global dashboard for all users or a home dashboard for individual users):
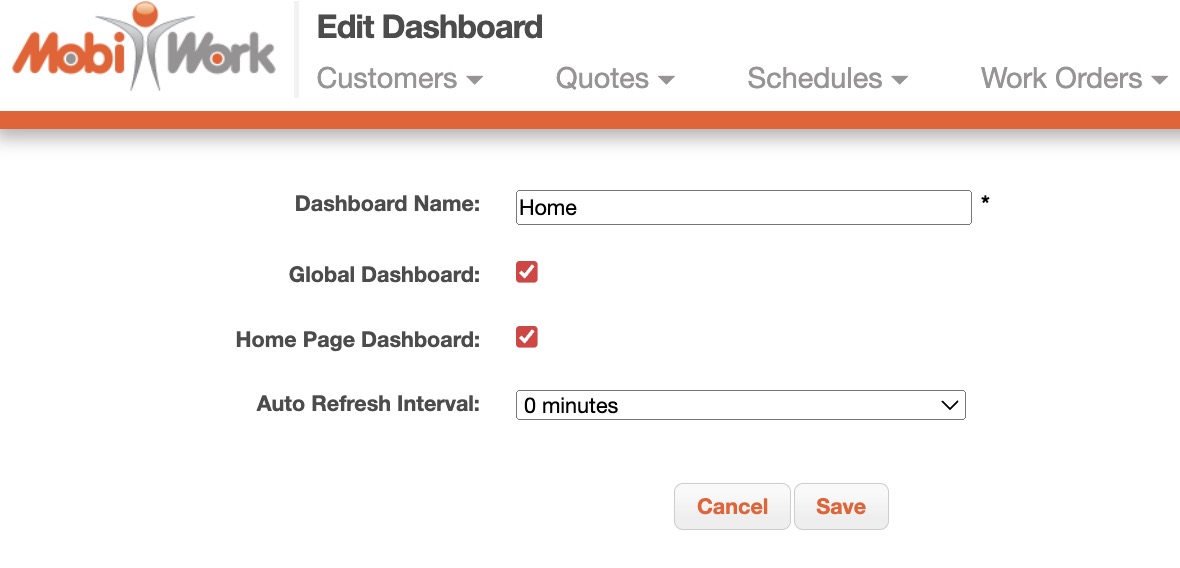
Once you are satisfied with the changes to the dashboard, click the Save button.
Dashboard Panels
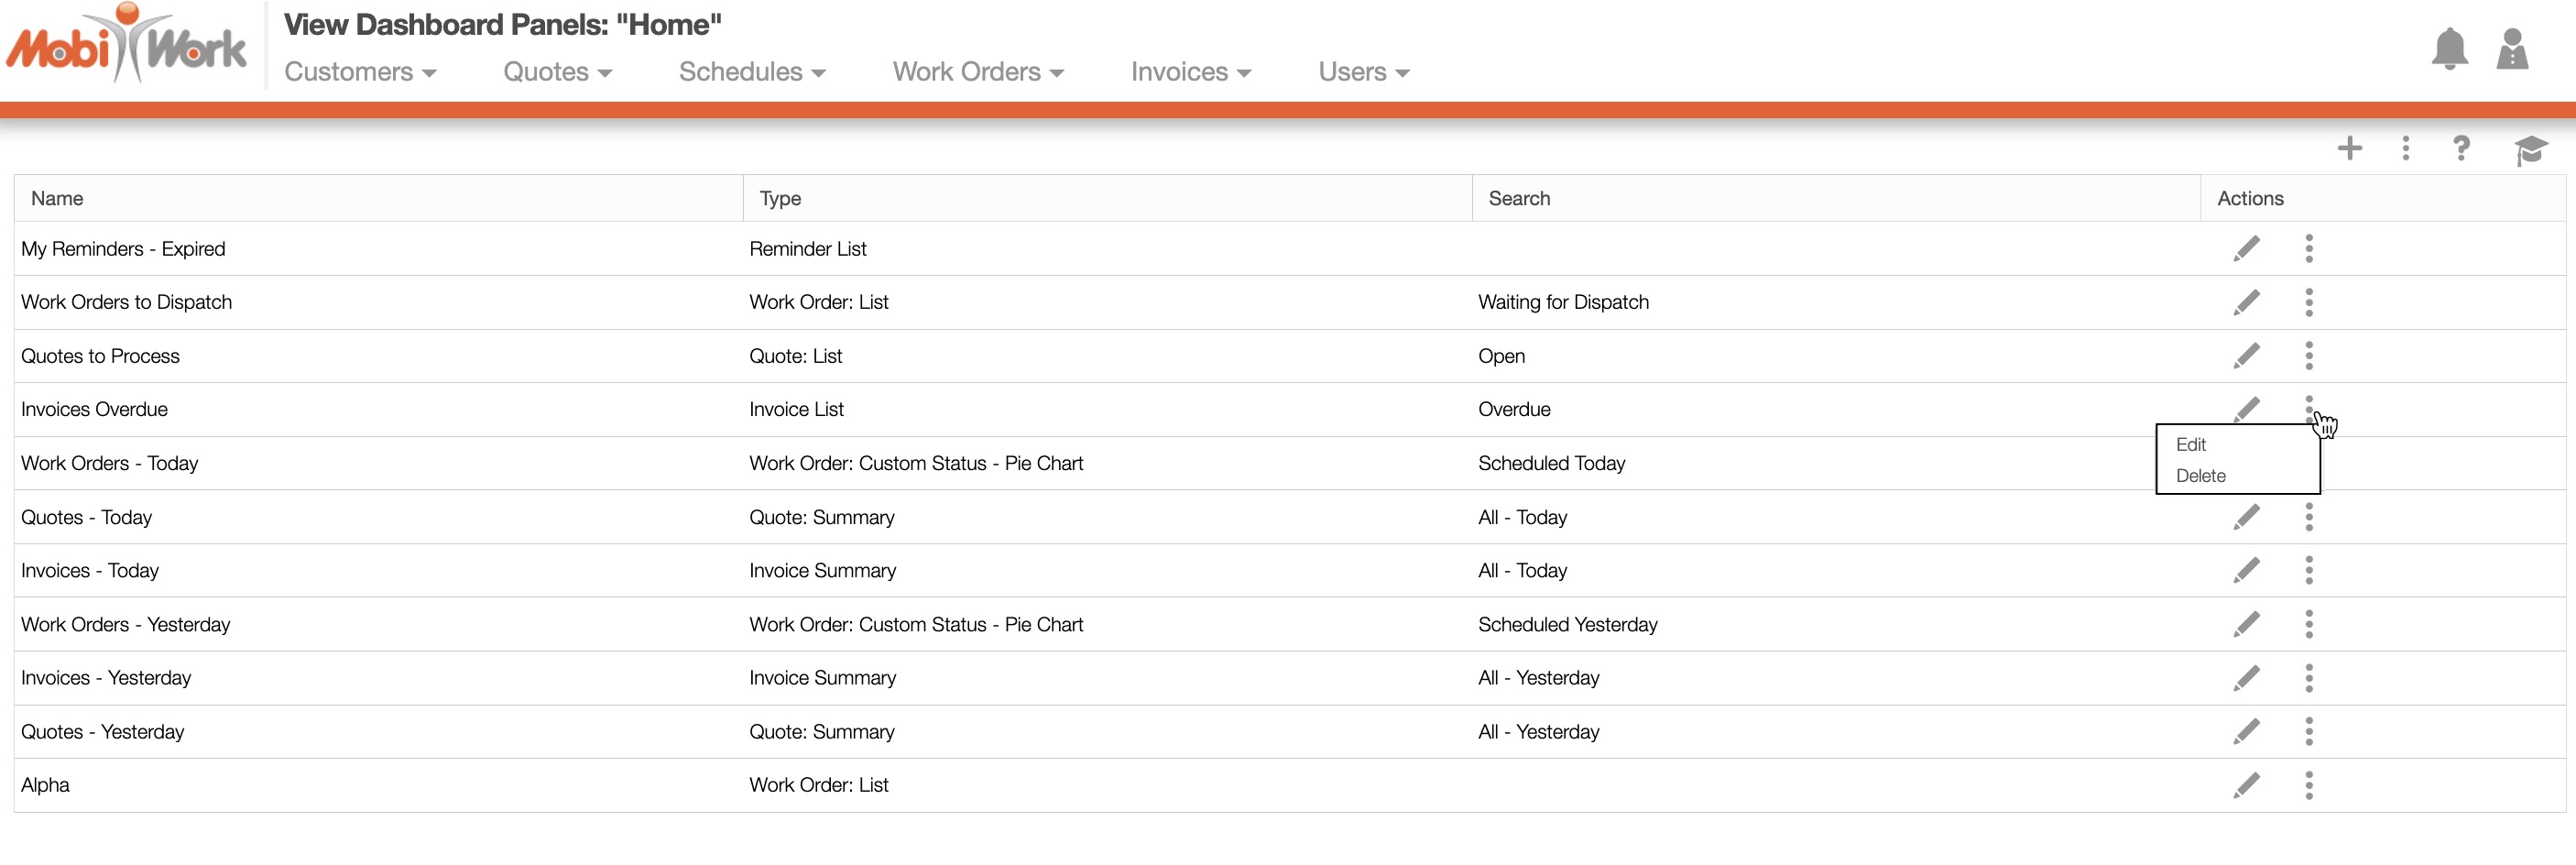
To edit or add additional dashboard panels to your dashboard, select the "View Dashboard" option from the "Dashboard" column. You will then be brought to the View Dashboard page:
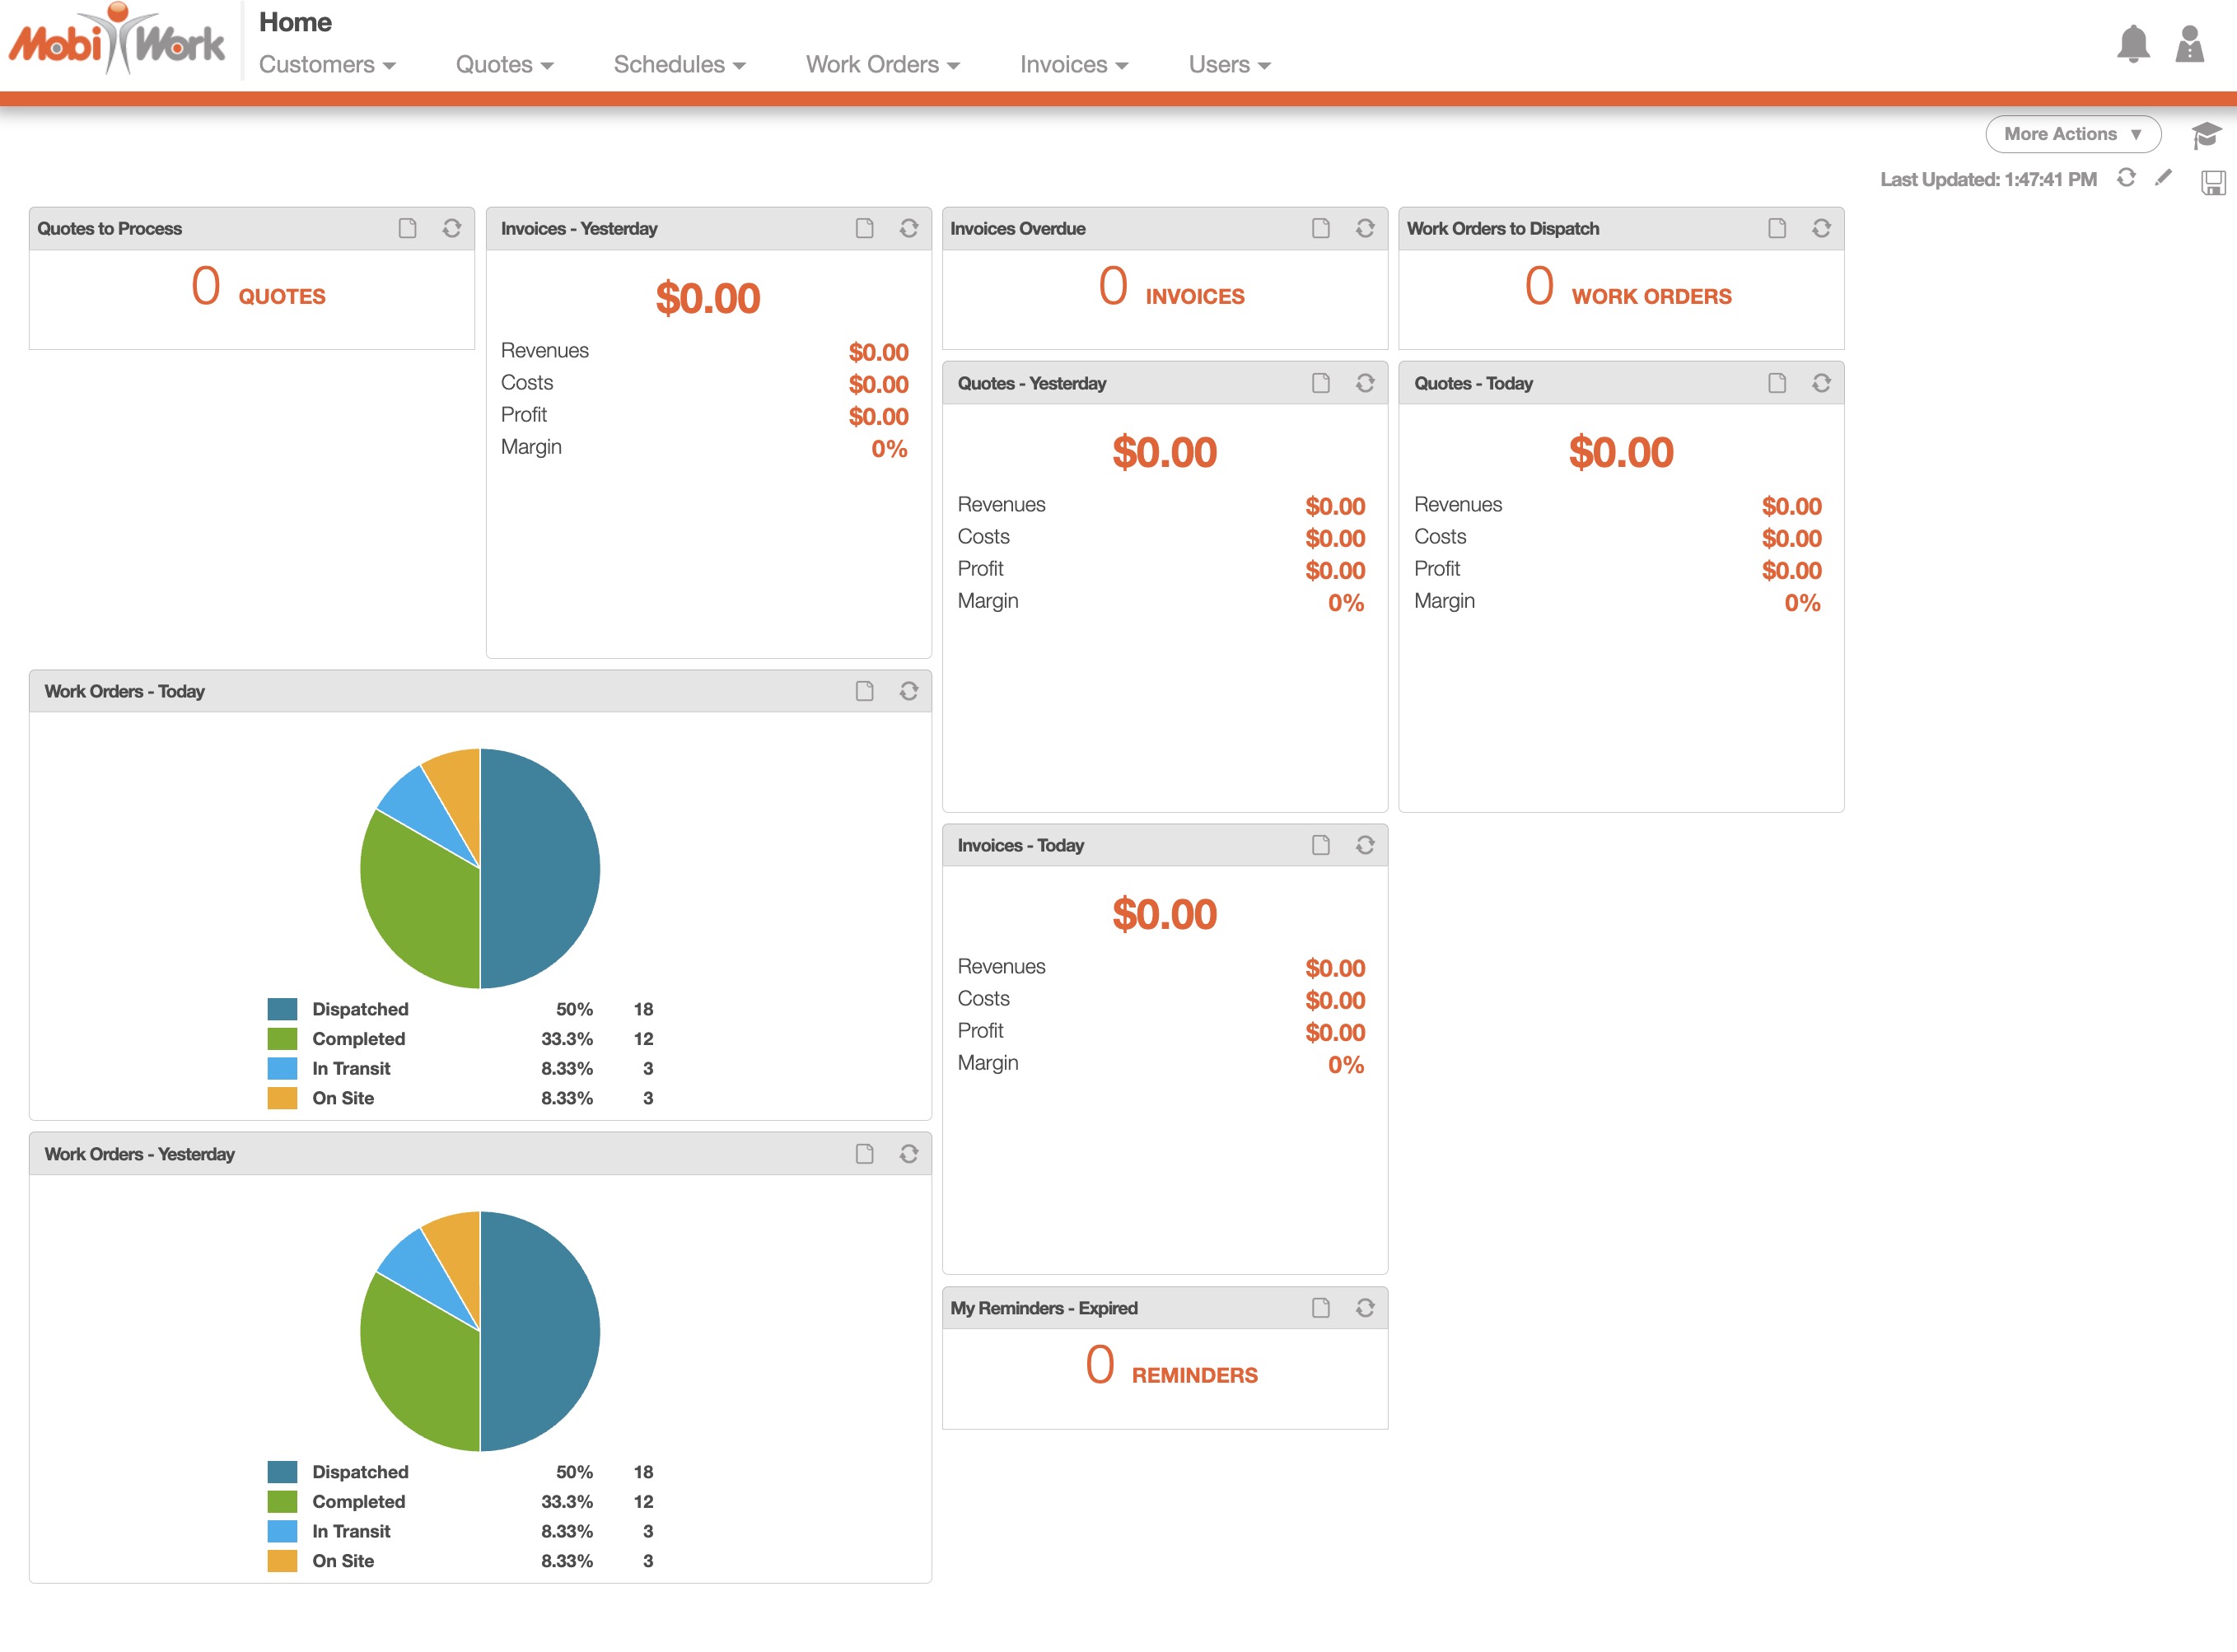
The View Dashboard page will display all the associated panels and their data, as well as, how your dashboard (including panels and layout) will appear if set as your homepage. On this page you will be able to modify the layout of the panels and add additional panels to the dashboard.
Your homepage dashboard is the default dashboard that will appear once you login to the MobiWork web application.
Enter the dashboard panel name
The type of data being displayed
The show only count
The desired saved search
The dashboard panel name
The type of data being displayed
The show only count
The desired saved search
Add a Dashboard Panel
From the "Dashboard" column select the "View Dashboard" option; you will then be brought to the View Dashboard page.
On the "View Dashboard" select the "Add Dashboard Panel" from the More Actions button to add new data panels to your dashboard:
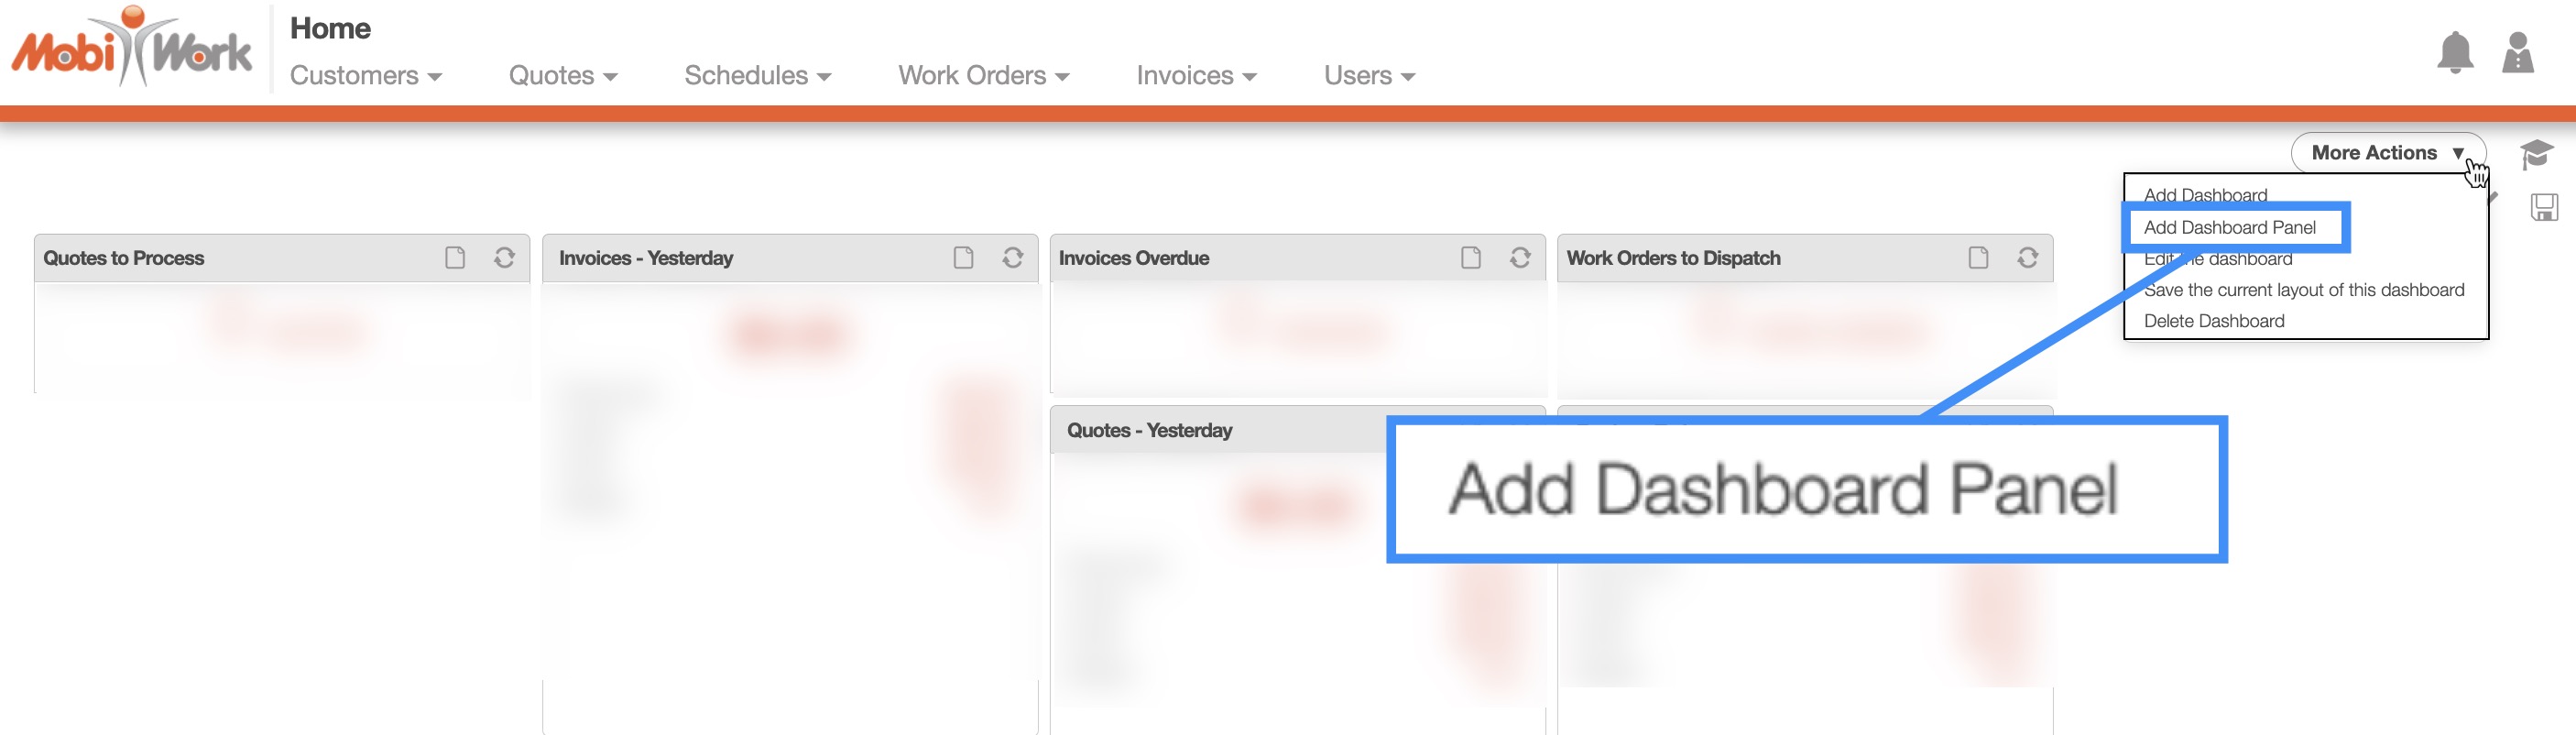
You will then be redirected to the Add Dashboard Panel page. On this page you can:
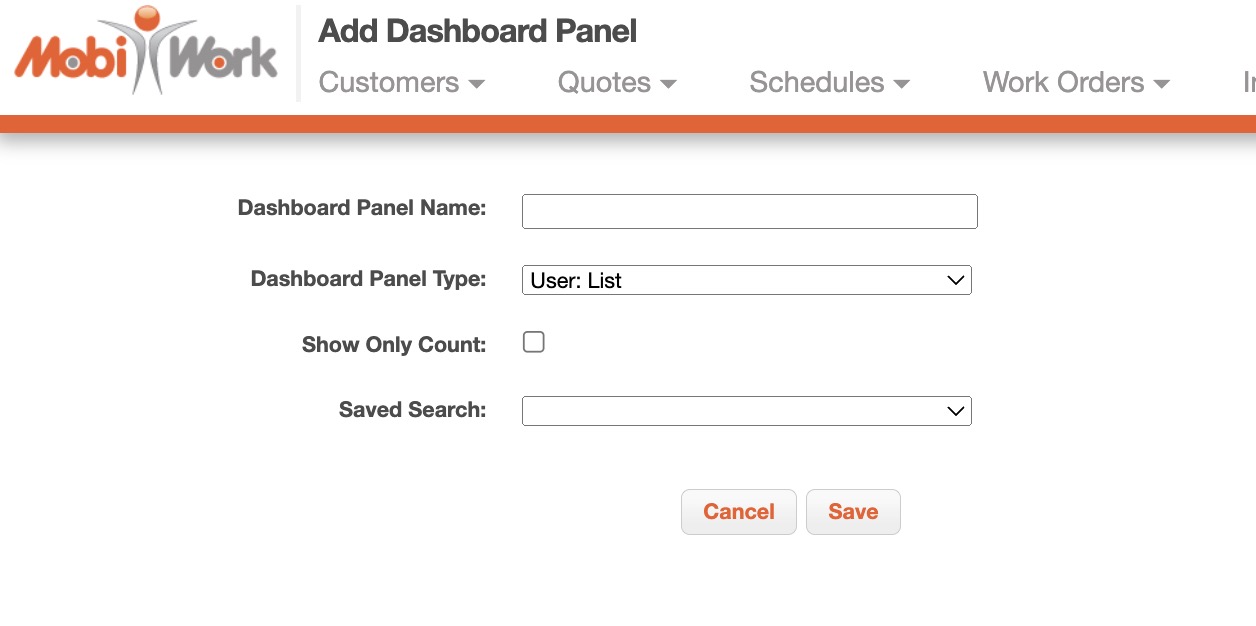
Once you are satisfied with the information entered, click on the Save button to finalize the new dashboard panel. You should repeat this process until you are satisfied with the panels that appear in the dashboard.
Edit the Dashboard Panel
You can also edit any existing dashboard panels by selecting the "Edit the Dashboard" option from the More Actions button or clicking on the Pencil icon:
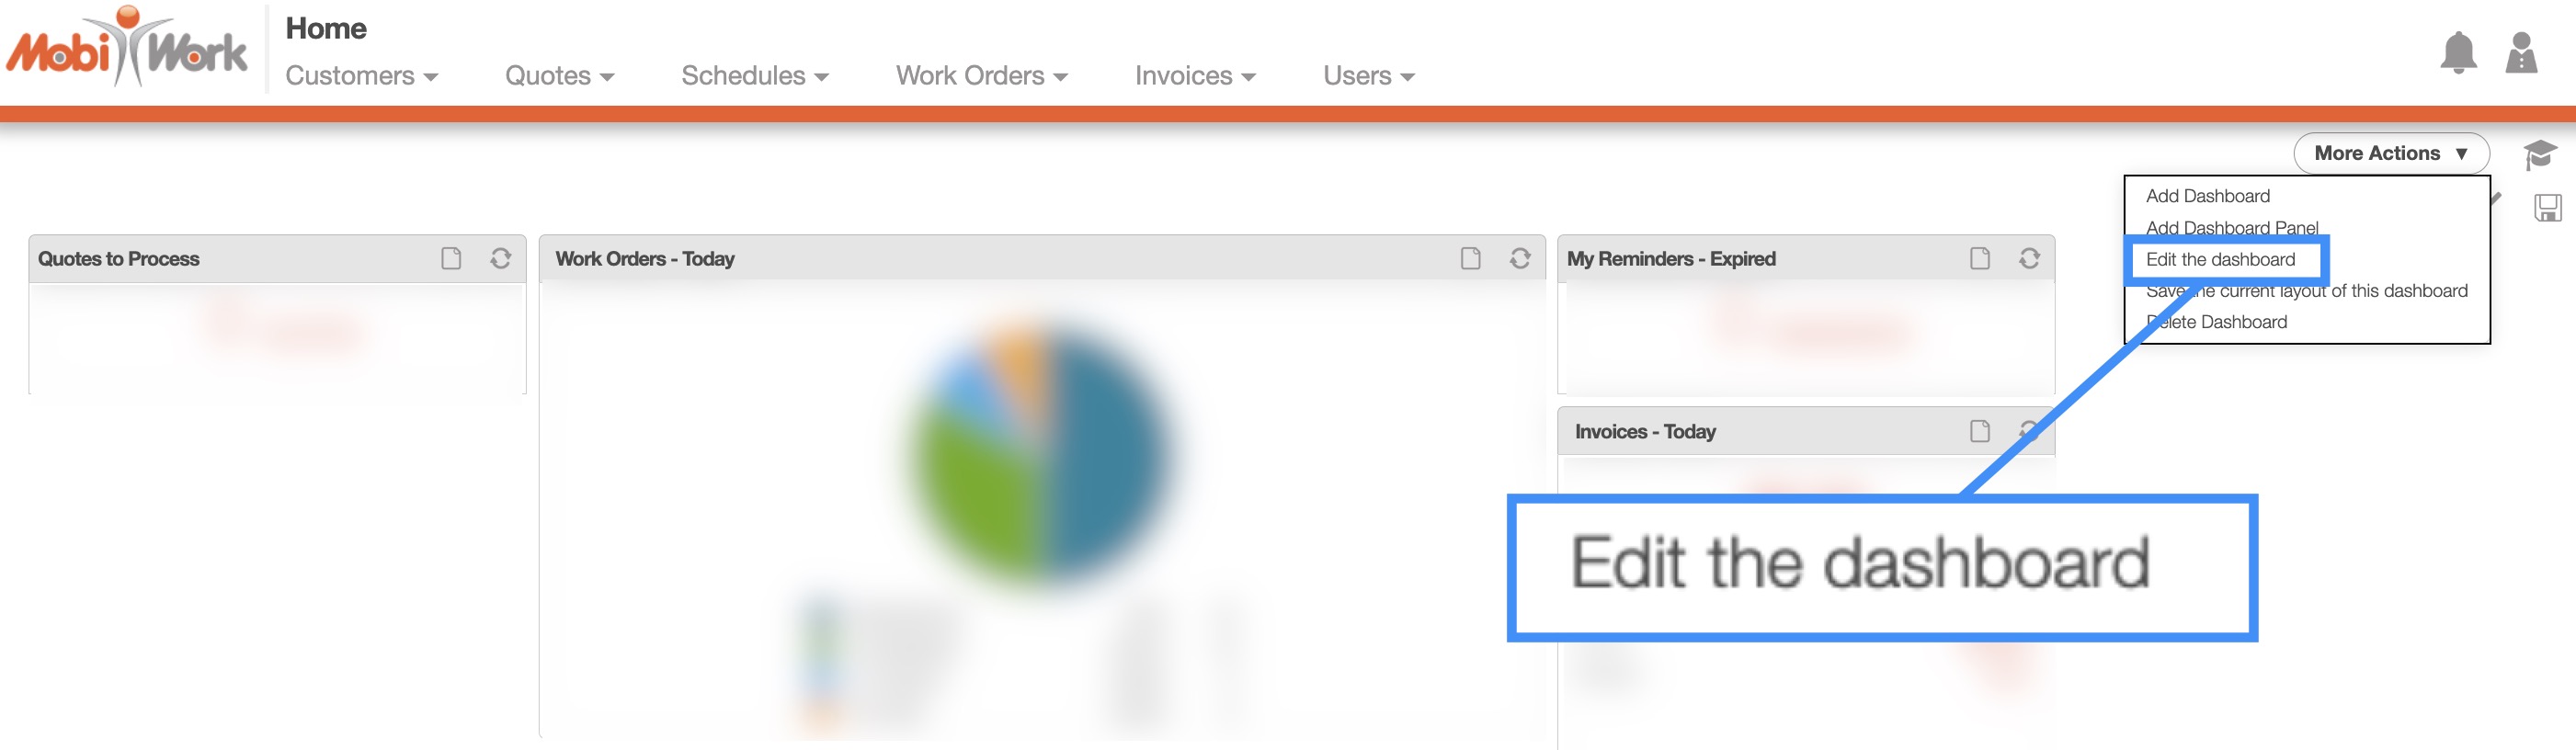
All of the panels that are associated with your dashboard will then appear. From this page, you can select an individual dashboard to edit by clicking on the Pencil icon or selecting the "Edit" option from the Individual Actions button:
You will then be redirected to the Edit Dashboard Panel page. On this page you can edit:
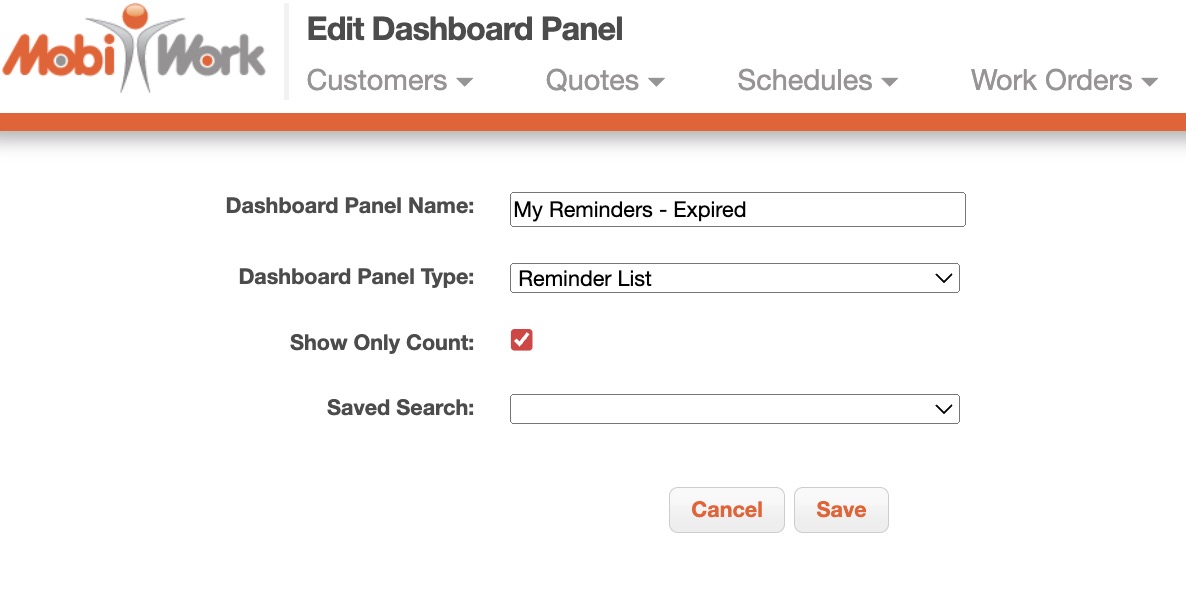
Once you are satisfied with the information entered, click on the Save button to finalize the updated dashboard panel.
Note: You can have multiple panels of the same type but with different data displayed. For example, you can have multiple Work Order List panel types, where one panel shows closed work orders, and another panel depicts open work orders. This ability to display multiple panels of the same type but with different data, will allow you to see a snapshot of everything going on in one screen.
The definitions for the panel types and the saved searches found on this page can be located below:
| Name: | Description: |
|---|---|
| "Dashboard Panel Name" | is the name of the dashboard panel. |
| "Dashboard Panel Type" | is the dashboard panel type. |
| "User: List" | displays the users who are using your MobiWork account. |
| "User Training: Chart" | is the user training that is up to date and overdue in a pie chart. |
| "User Training: List" | is the user training that is up to date and overdue in list format. |
| "User: Maintenance Status by Service Type" | is the user: maintenance status by service type in bar chart format. |
| "Last Known Location: Maps" | displays the last known location on a map by user, date, and time. |
| "Last Known Location: Inside Status - Chart" | displays the number of users inside a point of interest. |
| "Last Known Location: Device Status - Chart" | is the active, recent (within the last 90 minutes), active (between 90 minutes and 1 day), and no recent communication (over 1 day) in a pie chart. |
| "Last Known Location: Absence Time - Chart" | displays the last time users communicated with MobiWork. |
| "Last Known Location: Inside Status group by Supervisor - Chart" | displays the number of users inside a point of interest grouped by the supervisor of the users. |
| "Work Order: Status - Bar Chart" | displays the work orders closed vs not closed in a bar chart. |
| "Work Order: Custom Status - Pie Chart" | displays the custom statuses of work orders in a pie chart. |
| "Work Order: List" | displays the work orders in list format. |
| "Work Order: Monthly Numbers - Bar Chart" | displays the monthly work orders added, scheduled, and closed in a bar chart format. |
| "Work Order: Assigned Status List" | displays work orders by customer, custom status, assigned to, and assigned date. |
| "Customer: Status - Pie Chart" | displays customers by status in a pie chart. |
| "Customer: Monthly Growth - Bar Chart" | displays the number of monthly new customers. |
| "Customer: List" | displays the list of customers. |
| "Device: Status - Chart" | displays user devices by status (active, recent communication, active, and no recent communication) in a pie chart. |
| "Device: List" | displays a list of devices that use the MobiWork app. |
| "Prospect: List" | displays a list of prospects. |
| "Alarm List" | displays a list of alarms. |
| "Message List" | displays a list of messages. |
| "Reminder List" | displays a list of reminders. |
| "Time Tracking Single User View" | displays time tracking information of a single user. Time tracking can be added from this dashboard panel. Note: Saved search should return records for one user. |
| "Payment Summary - User" | allows you to show payment collection based on each user. |
| "Planogram Audit list" | displays a list of planogram audits. |
| "Planogram Audit Compliance" | displays compliant and non-compliant planograms in a pie chart format. |
| "Support Ticket List" | displays a list of support tickets by name, status, and clients. |
| "Notification: List" | displays a list of notifications. |
| "Invoice List" | displays a list of invoices including their total and balance. |
| "Task List" | displays a list of tasks including their status. |
| "Saved Search" | displays the list of saved searches already created for that entity. The dashboard will show the results from the selected saved search. |
Edit Dashboard Panel Layout
You can also change the size and location of the panels on your dashboard. To modify the layout of your panels, you will first need to be on the View Dashboard page:
Once you are on this page you can drag & drop to move the selected dashboard panel to the desired location:
To change the size of a selected panel, bring your cursor to the corner of the panel and then expand or minimize as desired:
Once you are satisfied with the new layout of the panels, access the More Actions button in the right corner and from the drop-down select the "Save the Current Layout of This Dashboard" option.
This option will ensure that dashboard panels are saved in the desired layout for future use.